Natal
About this chapter
This chapter covers creating, viewing, editing, and printing the single wheel (the natal chart).
Creating a natal chart
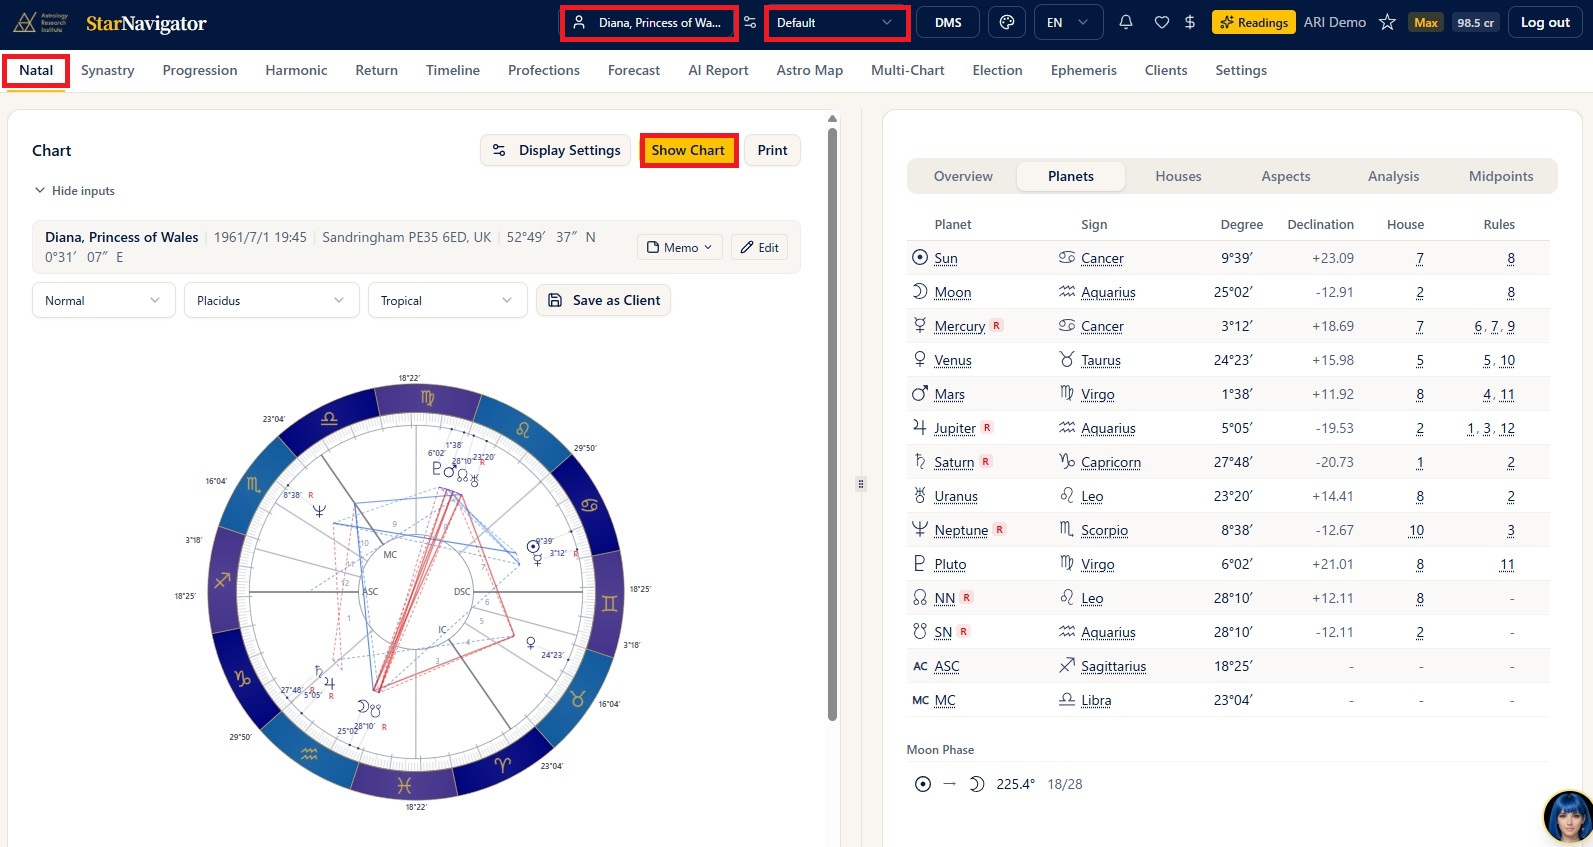
Steps
- Choose the birth data from the birth data picker in the header.
- Choose the preset you want to use in the preset picker.
- Choose Natal from the menu.
- Press Show Chart and the natal chart appears on the left with the data tabs on the right (on a PC). On a smartphone they are stacked, with the chart on top and the data tabs below.
Notes
- Degree notation can be switched between decimal and degrees-minutes in the header.
- On a PC you can drag the bar in the middle, at the boundary between the chart and the data panel, to adjust their widths.
Entering and registering birth data on the Natal screen
- Instead of choosing from the birth data picker, you can type data directly on the Natal screen and build the chart there. Just enter the date, time, and place in the birth data form at the top of the chart and press Show Chart (no registration needed). This is handy for short readings (see "Editing and saving birth data" below).
- To register the data you entered, press the Save as Client button above the chart. You can give it a name (and, depending on your plan, a folder). After registering, that record is left selected, so you can use it in the other charts right away.
Producing a transit chart for the current moment (horary and the like)
- Pressing the Natal button while the birth data picker is empty creates a transit chart for the moment you pressed it, at the default observation location you have configured. This is ready to use when you want the chart of "right now" for horary and similar work.
Producing a new moon or full moon chart
- Choosing a new or full moon from the astronomical events under Shared Data in the birth data picker and pressing Show Chart produces the new or full moon chart as a single wheel. You do not have to look the date and time up and register it yourself.
- The location used is the default observation location you have configured. To see it for a different place, change the place in the birth data form on the chart screen and press Show Chart.
- For details see "Shared data (astronomical events such as new and full moons)" in the Clients chapter. How to read a new or full moon chart overlaid on a natal chart is explained under "Overlaying a new or full moon chart on the natal chart" in the Synastry chapter.
Dragon Head and Dragon Tail charts (draconic charts)
Besides the ordinary natal chart, the single wheel can display a Dragon Head or Dragon Tail chart (Pro plan and above). The Dragon Head chart is what is generally called a draconic chart.
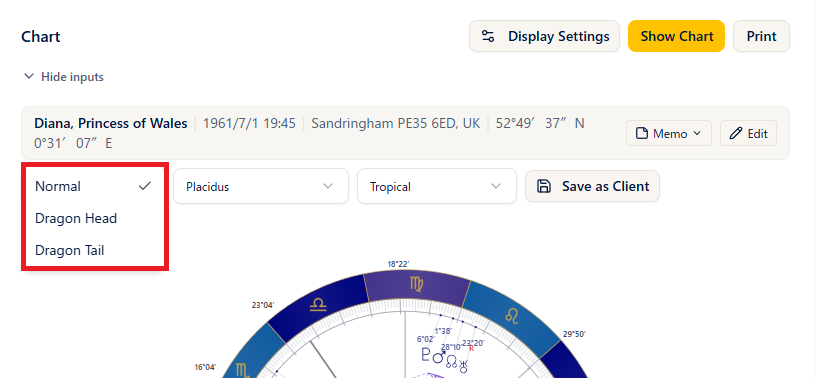
Steps
- Open the Chart Type selector above the chart (below the birth data display), which reads Normal.
- Choosing Dragon Head or Dragon Tail switches the chart and the data tabs immediately (there is no need to recalculate).
- Returning it to Normal brings back the original natal chart.
Notes
- The Dragon Head chart rotates every planet and house cusp by the same angle so that the North Node (Dragon Head) falls on 0° Aries; the Dragon Tail chart does the same so that the South Node (Dragon Tail) falls on 0° Aries.
- The house system carries over unchanged from the one selected for the ordinary single wheel.
- When you print, "Dragon Head" or "Dragon Tail" appears in the header and in the file name.
The chart display and the panels
Steps
- Press Show Chart and the chart appears on the left with the data on the right (below, on a smartphone).
- On the right, switch tabs to see the various sets of data.
Notes
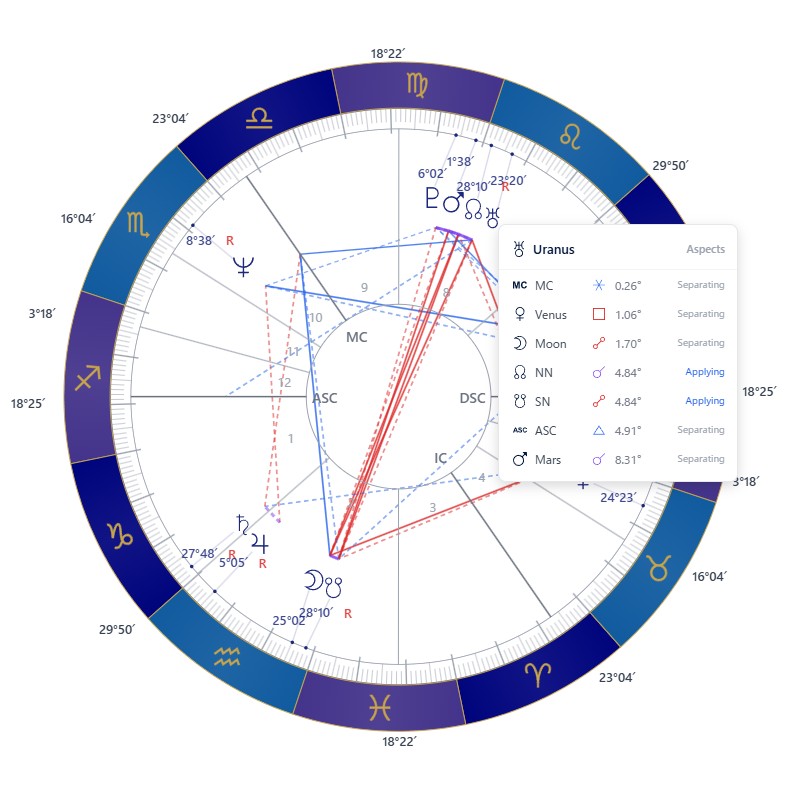
- The degrees around the outside of the chart are the degrees of the house cusps.
- Clicking a planet on the chart pops up the list of aspects to that planet. It also shows whether each aspect is applying or separating.
- The data tabs show only the items selected in the preset you have chosen. Each tab contains the following.
- Overview tab: uses the same layout as the previous StarNavigator, showing the planet and house information side by side with the aspect grid below.
- Planets tab: shows planet / sign / degree / declination / house occupied / houses ruled. Underlined items (planets, signs, houses, and so on) show their meaning when clicked. The moon phase is shown here as well.
- Houses tab: shows the sign and degree of each house cusp, the planets in the house, and its rulers.
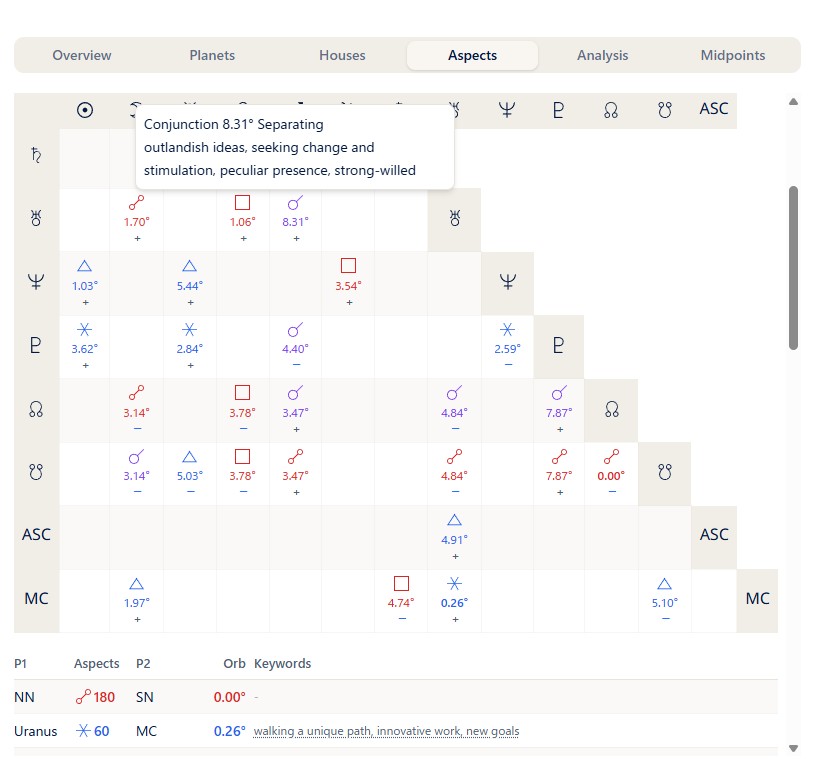
- Aspects tab: shows the aspect grid, a list of aspects in orb order, and the aspect patterns. Below the grid is a list, ordered from the tightest (smallest orb) aspect, with keywords. Below that, aspect patterns (special figures formed by several planets) are detected automatically and listed. In the aspect list and the grid, applying aspects are marked with a minus sign and separating aspects with a plus sign. At the bottom of the tab, planets with no aspect to the main planets (and planets with no major aspect) are listed when there are any.
- Analysis tab: shows the summaries (moon phase, modality, element, polarity, quadrant emphasis, Gauquelin sector planets, stellium, and critical degrees), the Dispositors chart, which overlays arrows tracing each planet's ruler on the wheel (Pro and above), and Chart Details (tight aspects, most aspected planets, angular planets, ASC ruler, essential dignity including the almuten (Pro and above), dodecatemoria, and antiscion). See the Analysis Tab chapter for each item, and the Dispositors chapter for the dispositor chart.
- Midpoints tab: shows the midpoints (half sums) (Plus and above). The controls at the top of the panel change what is displayed.
- Harmonic: choose from the H1(360) / H2(180) / H4(90) / H8(45) / H12(30) / H16(22.5) buttons. Custom lets you enter any number from 1 to 360.
- Display Mode: choose from four modes — All Axes (the list of midpoint axes), Stimulation (only the axes being stimulated by a planet, with the stimulating planet shown as well), Tree, and Graph (a dot plot; hovering over a dot shows the planet pair and the degree).
- Orb: adjustable within a range of ±0.5 to 10 degrees.
- Planets: tick the planets to include. Selecting planets under Highlight Planets colors only the midpoints that involve those planets.
- Pressing the print button prints exactly what the currently selected display mode shows.
Meanings are available on the spot
Underlined items on the chart and the data tabs — planets, signs, houses, aspects, and so on — show their meaning when clicked. There is no need to look things up in a dictionary, which helps both beginners who are learning and practitioners checking something during a reading.
The orbs for aspect patterns
The orbs used for aspect patterns are fixed by the system.
Stepping (animating the chart)
The controls below the chart let you advance the date and time little by little and watch the chart change, like an animation (Pro and above).

Steps
- Choose the Interval (1 day, for example) and the Speed (1s, for example) below the chart.
- Pressing Play advances the date and time automatically and the chart changes as it goes. Pressing 1 Step advances one frame at a time.
- Ticking Backward moves back into the past instead.
Display and printing
Steps
- The Print button prints the chart and the data (Basic and above).
- Clicking the wheel enlarges it, and from the enlarged view you can save the image with PNG (PNG saving is Basic and above).
Notes
- Degree notation (decimal or degrees-minutes) follows the degree mode in the settings.
Display Settings
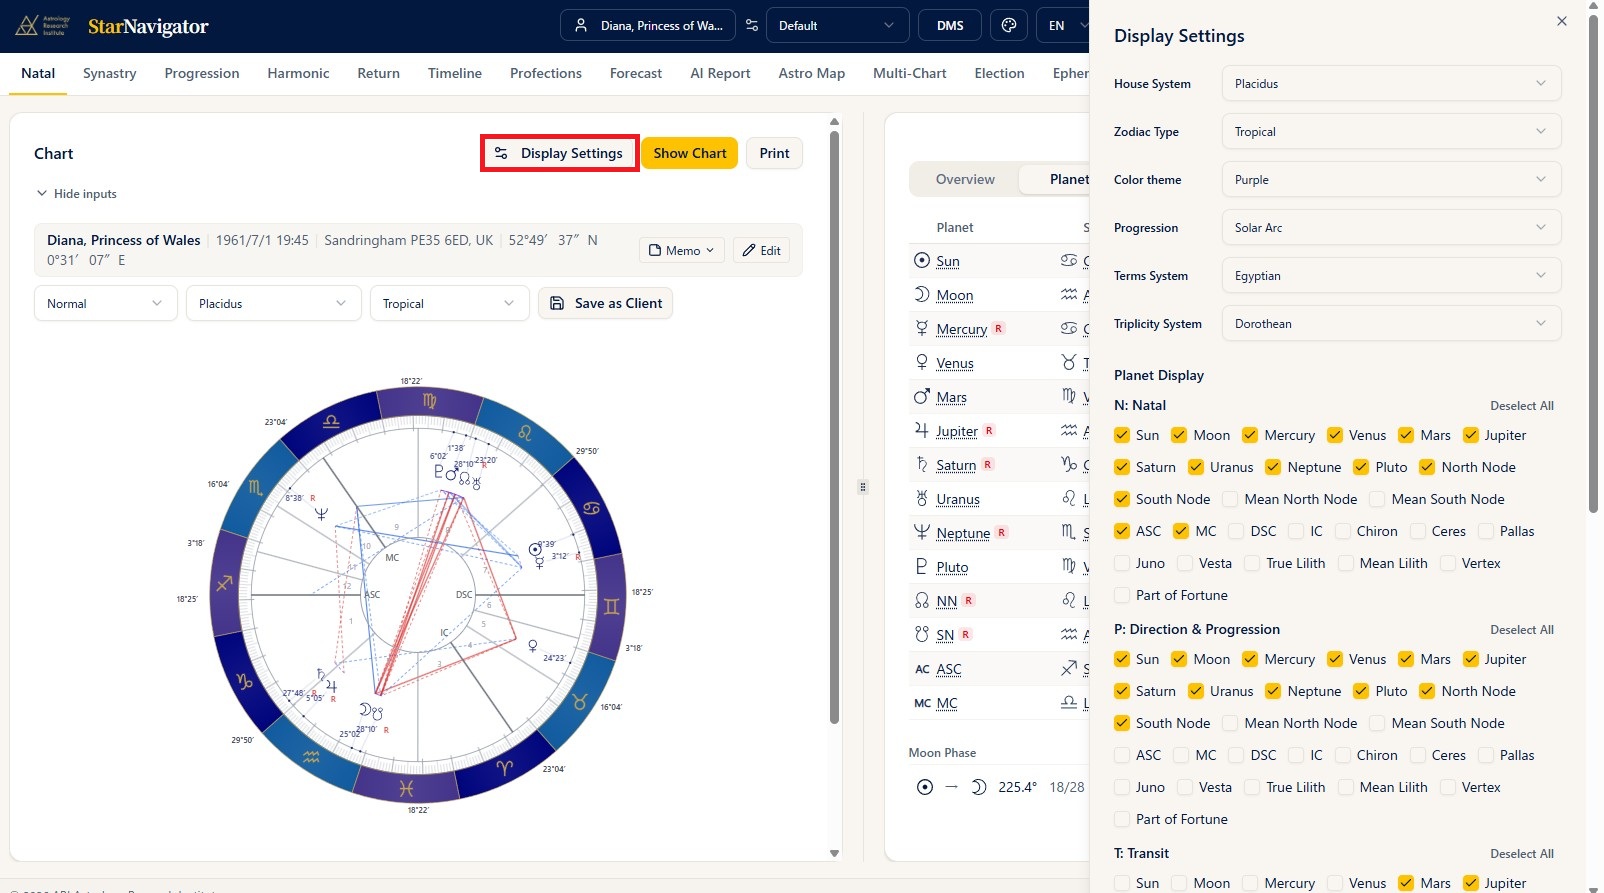
Steps
- Press the Display Settings button on the chart screen.
- Switch planets, aspects, orbs, the house system, the progression method, and so on, on the spot.
- The chart and the data in the right panel are redrawn immediately.
Notes
- To write your changes back into the current preset, press the Overwrite button.
- To keep them as a new preset, enter a preset name and press New.
- If you move to another screen without pressing either, the changes apply only to that chart and are not saved to the preset.
- On the Max plan this panel also contains the Traditional items, so you can switch the lots, antiscia, term and face rings, and the profection ring on the spot. See the Traditional (Profections and Lots) chapter for details.
About plans
Using Display Settings on a chart screen is available on the Plus plan and above.
Editing and saving birth data
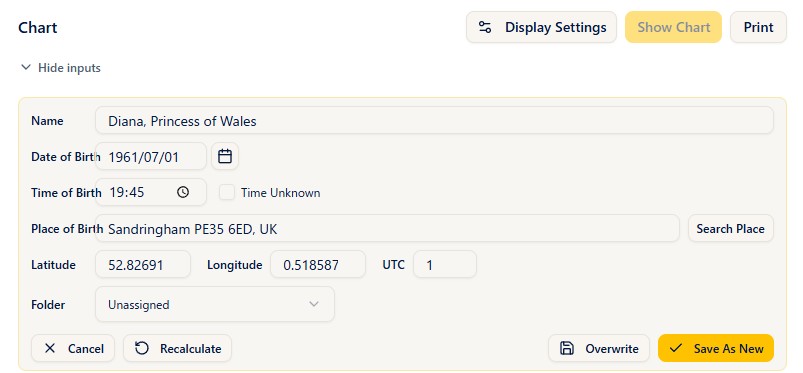
Steps
- The birth data form at the top of the chart is already open (there is no edit button to press first).
- Correct the name, date of birth, time of birth, or place of birth on the spot.
- Pressing Show Chart recalculates the chart and the data panel from whatever the form currently holds.
- To overwrite the original birth data press Overwrite; to keep it as a separate record press Save As New. Editing alone saves nothing.
- In the same way, the Memo button lets you edit and save the memo field of the birth data on the spot.
Notes
- Once the chart is drawn, the form collapses automatically. Use Show inputs to open it again.
- If you open a chart while the birth data picker is empty, a transit chart for "the current date and time at your default observation location" is set up. From that state, changing the date, time, or place in the form lets you build a chart on the spot without registering any birth data.
When the chart is dimmed
While the displayed chart no longer matches the form, the chart is dimmed and a notice appears over it. This happens when you pick a different person with the picker, or change a value in the form. Pressing Show Chart redraws the chart from the current input and the notice disappears. It is there so that the previous person's chart is never misread as the one you have just selected.
The memo field can be updated straight from the chart screen
Anything you notice during a reading can be edited and saved on the spot from the Memo button on the Natal screen. There is no need to go back to the birth data list. A saved memo stays attached to that birth data.
- When you want several versions of the same person — for rectification (estimating the birth time), for example — Save As New lets you register as many records as you like under different names.
- This mechanism of editing, memos, and overwrite / save-as-new works the same way on the other chart screens, including Progression, Synastry, and Forecast.